
You have a homepage that is not converting, a pricing page people bounce off, and a demo form that half-fills and gets abandoned. You suspect the copy or the layout is the problem, but you cannot prove it, and you cannot afford a research team to find out. That is the position most B2B marketers I talk to are in, and it is solvable without hiring anyone. UX research is not one expensive thing; it is a set of methods, and each one answers a different question at a different cost.
The point of this guide is to match the question you actually have to the cheapest method that answers it, so you stop guessing and stop paying for research you do not need.
1. What UX research is really answering
UX research is the work of watching what people do on your pages and asking why, instead of deciding from the inside what they want. Most teams skip it because they picture lab studies and recruiting fees. In practice, the useful version is closer to five people, a screen recording, and a specific question you wrote down first.
Nielsen Norman Group's usability research has argued for years that a small number of test participants surfaces most of the serious problems on a page, which is why you do not need a statistically clean sample to learn something you can act on. You can read their published usability research for the reasoning behind that. Some website questions need numbers from a large sample, and some need a recording of one confused person trying to complete a task.
2. Which method answers which website question
Before you pick a method, name the question. "Where do people get stuck on the pricing page" is a behavioral question you answer by watching. "Does version A or version B get more demo requests" is a quantitative question you answer by testing at volume. Running the wrong one wastes the budget you were trying to protect.
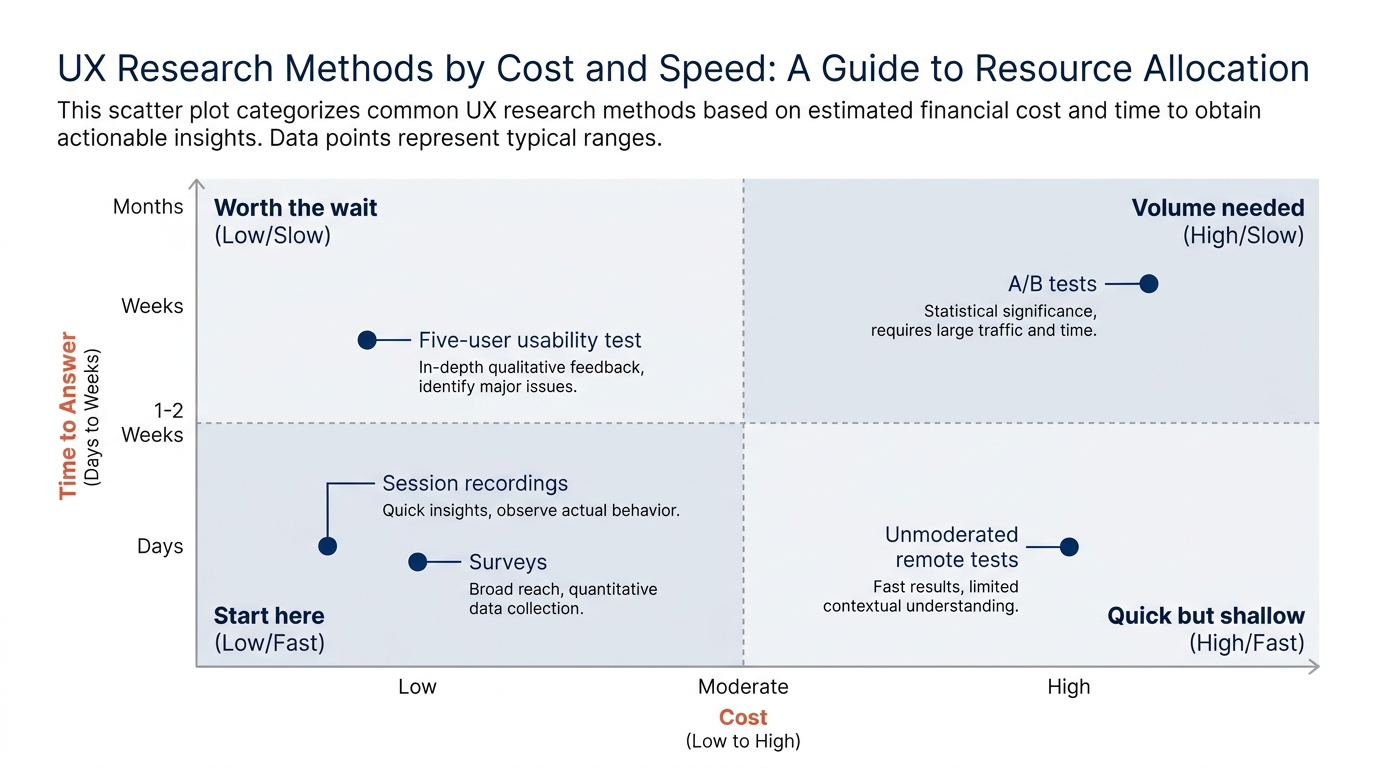
Here is how the common ux research methods line up by what they tell you, roughly ordered from cheapest and fastest to slowest.
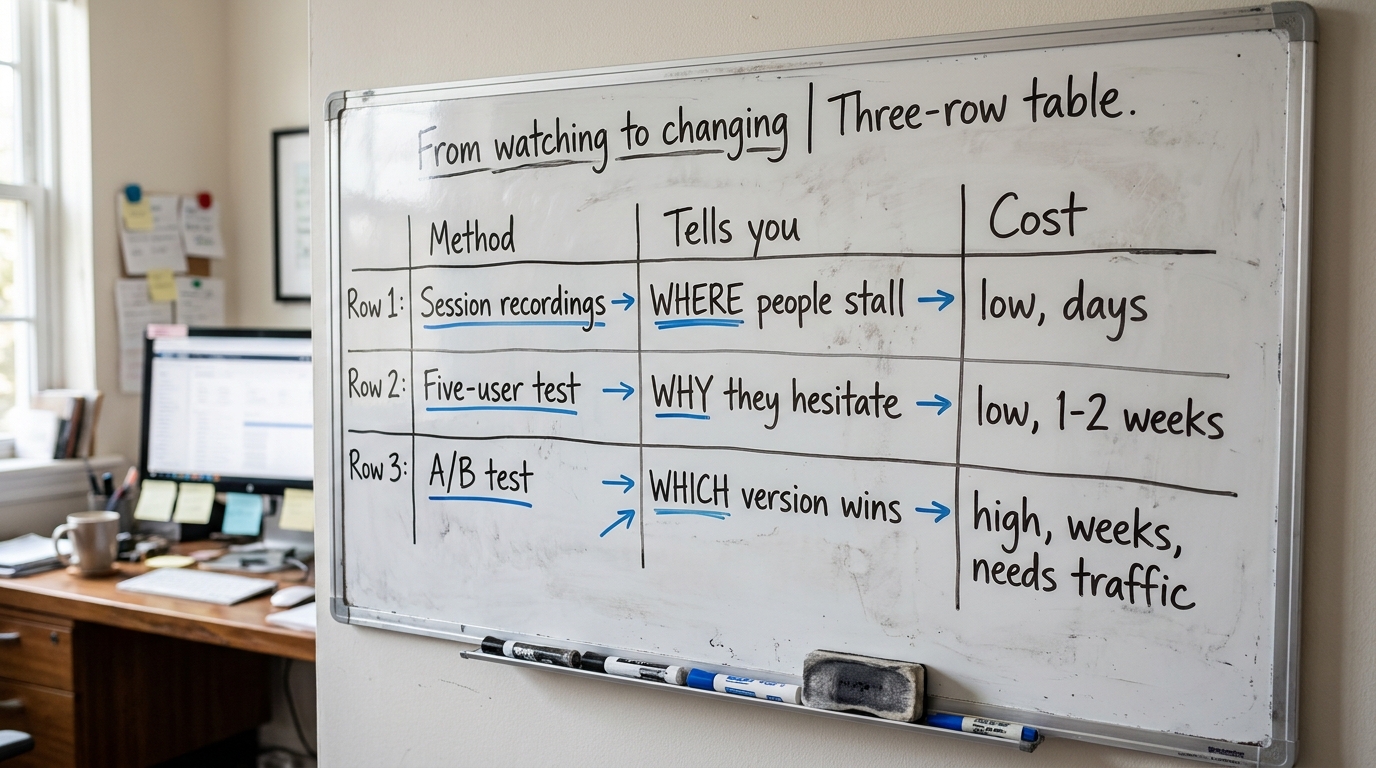
- Session recordings and heatmaps. Cost: low. Time: days. Answers where attention goes and where people abandon. Good first move because it runs passively on your live traffic.
- Moderated usability tests, five users. Cost: low to moderate. Time: one to two weeks. Answers why people hesitate, in their own words. This is the highest-value qualitative research for the money.
- Unmoderated remote tests. Cost: moderate. Time: days. Answers whether a specific task completes, at slightly larger numbers, without you sitting in.
- Surveys and exit-intent questions. Cost: low. Time: days. Answers what the buyer was looking for and did not find. Weak on why, strong on what.
- A/B tests. Cost: moderate to high, mostly in traffic. Time: weeks. Answers which version converts better, but only if you have enough visitors to reach significance.
A/B testing is where small B2B teams burn time they do not have. Most B2B sites do not have the traffic to call a test honestly, and Evan Miller's explanation of how not to run an A/B test is worth reading before you start, because stopping a test the moment it looks good is the single most common way to fool yourself.
3. Where this shows up on a B2B website
Research questions are not abstract. They live on specific pages, and the behavior you are chasing changes by page. The homepage is where most of the confusion starts, and the data backs that up. In Behavly's index of 118 B2B service firms from November 2026, 49% lead their first screen with AI wording and 33% ask the visitor to do nothing at all, which means a third of these sites give a motivated buyer no next step. You can see the full breakdown in the November 2026 homepage trends.
The pricing page is the second place behavior breaks, and it breaks quietly. Only 3% of those 118 sites show a price at all, so the buyer who came to compare leaves to go ask a competitor who does. Watching how far people scroll before they give up tells you whether pricing is the weak point, because the problem is structural rather than a matter of better copy. If pricing is your weak point, the mechanics of how buyers read a price are covered in pricing psychology for B2B services.
Further down the funnel, the demo form and the proposal are where qualified people drop. Baymard Institute's checkout and form research, which you can browse at Baymard's UX research hub, is mostly ecommerce, but the form findings translate directly: every extra field costs you completions, and buyers abandon when a form asks for more than the step is worth.
4. A worked example on one pricing page (illustrative)
Here is how one round of cheap research plays out on a single page. This is an illustrative walk-through, not a client result, so treat the specifics as a pattern rather than a number to quote.
Say your pricing page has no price, three tiers described in feature lists, and a "Contact sales" button under each. You run session recordings for a week first, because they cost almost nothing and run on live traffic. You watch twenty sessions and notice people scroll to the middle tier, hover, scroll back up, and leave. That is the question found: something about the middle tier stalls them.
Then you run five moderated tests, because recordings showed you where to look but not why. Watching five people talk through the page, you hear the same thing: they cannot tell which tier is for a company their size, and with no price they will not click "Contact sales" to find out. Now you have the why, in their words, from qualitative research that took a week.
The change writes itself. Add a plain "best for teams of X" line to each tier, show a starting price or a range, and change the button copy from "Contact sales" to something that names what happens next. Whether a range or an exact figure works better depends on how you frame the number, covered in price anchoring on B2B pricing pages.
5. The table to work from
This is the part to keep. Map where the behavior shows up, what the buyer actually does there, and the change that follows. Use it as a worksheet: fill the middle column from your own recordings before you touch the third.
| Where it shows up on the page or sale | What the buyer does | What to change |
|---|---|---|
| Homepage first screen | Reads the AI-heavy headline, cannot tell what you do or for whom, leaves | Replace the category line with the problem you solve and for which kind of company |
| Homepage, below the fold | Scans for a next step, finds none (33% of sites ask for nothing) | Add one clear primary action; see call to action copy for B2B websites |
| Pricing page | Scrolls for a number, finds none (only 3% show a price), leaves to a competitor | Show a price, a range, or a "starts at"; name who each tier is for |
| Proof section | Looks for evidence this works for a company like theirs (80% show case studies, often generic) | Lead with a case that matches the visitor's segment; see social proof on B2B websites |
| Demo or contact form | Starts filling, hits a field that feels too early, abandons | Cut fields to the minimum the step needs; move the rest to a later stage |
| Proposal or sales call | Compares your number against an unstated reference point and reads it as high | Set the reference first; see anchoring bias in B2B proposals |
6. Reading the why behind the behavior
Watching tells you where people stall. It does not always tell you why, and the why usually comes down to how buyers weigh risk. A B2B purchase carries career risk for the person signing, so hesitation at the form or the price is often not confusion but caution. Daniel Kahneman's work on how people judge gains and losses, recognized with the 2002 Nobel Prize in Economic Sciences, is the clearest account of why a buyer treats a possible loss as larger than an equal gain.
That is why a page that only sells upside underperforms a page that also removes the downside. Once your recordings show where people stall, the fix is often to lower the perceived risk at that exact spot, which is the whole subject of risk aversion in B2B purchases and, on the copy side, loss aversion in B2B sales copy.
7. How to run the small version without a researcher
You do not need a hire to do this. You need a question written down, a tool that records sessions, and five people willing to talk through your page. The method matters less than the discipline of deciding what you are testing before you start.
If you are setting up your first round of moderated tests, the practical steps, including how to recruit five people cheaply, are laid out in user testing a B2B website on a small budget. If your problem is layout rather than copy, how people group and scan elements on a page is governed by predictable rules covered in Gestalt principles in web design. For a fuller catalogue of methods beyond the five here, there is a wider rundown of UX research methods worth a look.
One warning carried over from the A/B section: do not let a vanity method crowd out a useful one. Running a test that your traffic cannot support feels like rigor and produces noise. Watching five real people is less impressive and far more honest when your numbers are small.
8. What to change on your page this week
You can start the first method today and have an answer by Friday. In order:
- Write down your question. Pick the page losing the most qualified traffic and name what you want to know about it.
- Turn on session recordings. Let them run for the week on live traffic while you do nothing else.
- Watch ten to twenty sessions. Note where people actually stall on the page.
- Line up five short tests. Use the stall point from the recordings as the task you ask people to attempt.
- Make one change. Fix what the recordings and tests both pointed at, and leave the rest for the next round.
Run the loop monthly on one page at a time. A team with no researcher can clear most of its conversion problems this way inside a quarter, because the expensive part of UX research was never the method, it was deciding to look.
If you want a fast read on where your homepage stands before you start, run Behavly's free homepage check on your own page and see which of these problems it already has.