
You run a test on your pricing page, the variant pulls ahead on day three, and you ship it. Six weeks later conversion has not moved, and the change you were sure about turns out to have done nothing. That outcome has a name. In the language of hypothesis testing, type 1 and type 2 errors describe the two ways a website test can lie to you: a false winner you believe and roll out, and a real winner you miss and discard. For a B2B team running a handful of tests a year on low traffic, both are expensive, and the first one is easy to cause by accident.
This guide explains the two errors in plain words, names where they came from, shows them on the pages you actually test, and ends with a short list of things to change this week.
1. What the research says about the two errors
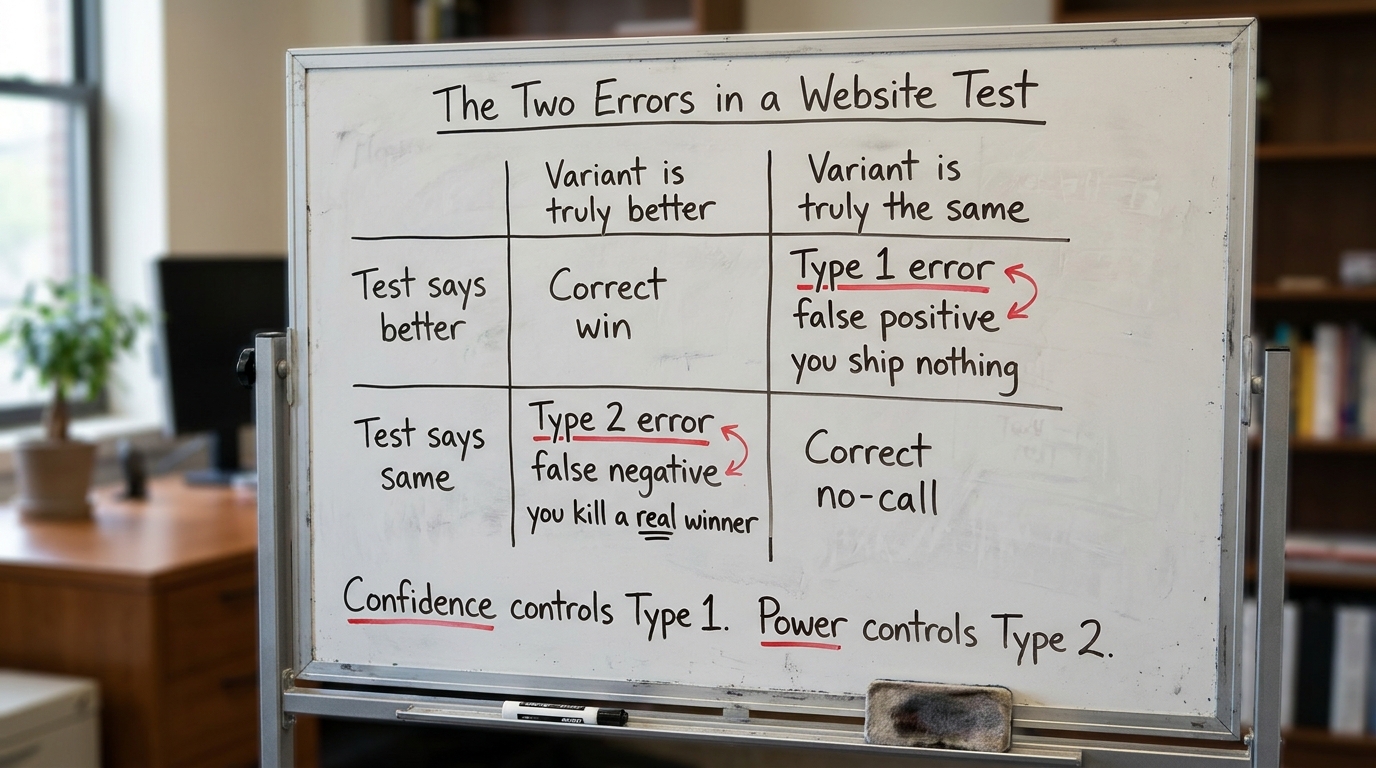
The framework comes from Jerzy Neyman and Egon Pearson, who in the 1930s formalized how to decide between two competing hypotheses. A type 1 error is a false positive: you conclude the variant is better when it is not. A type 2 error is a false negative: you conclude there is no difference when the variant really is better. You cannot drive both to zero at once, so every test is a trade between them.
Two numbers control that trade. Confidence (usually set so you accept a 5% false-positive rate) governs type 1 errors. Statistical power (often targeted at 80%) governs type 2 errors, and power rises with sample size and with the size of the effect you are trying to detect. Lower traffic means lower power, so missed winners pile up. Ron Kohavi, Diane Tang and Ya Xu cover this in depth in Trustworthy Online Controlled Experiments. It is the most practical reference for teams running web tests.
2. What each error costs a B2B team
A type 1 error costs you twice. You spend engineering and design time rolling out a change that does nothing, and you walk away believing something false about your buyers. That steers the next test in the wrong direction. On a B2B site where a single deal can be worth six figures, acting on a false signal about your demo form or your pricing layout is not a rounding error.
A type 2 error is quieter and often larger. You had a genuine improvement in hand, the test could not prove it with the traffic you had, and you killed it. The winner never ships. Because nothing visibly breaks, nobody counts the cost. Missed winners pile up on low-traffic sites that keep running underpowered tests because that cost stays invisible.
B2B traffic makes this worse. Most service firms do not get the thousands of weekly conversions a confident test needs, so power is low by default and the honest answer to many tests is "we could not tell."
3. Why checking a test every day produces false winners
The single most common way B2B teams manufacture a type 1 error is watching a running test and stopping the moment it crosses significance. Evan Miller explains the mechanism clearly in How Not To Run an A/B Test: a standard significance test assumes you look once, at a sample size you fixed in advance. Peek every day and stop at the first green result, and your real false-positive rate is far higher than the 5% you think you set.
The reason is simple. Random noise swings a metric above and below the line all through a test. If you only need it to cross the line once, and you check twenty times, you will catch a lucky swing eventually and call it a win. The variant did not get better; you just gave noise more chances to fool you.
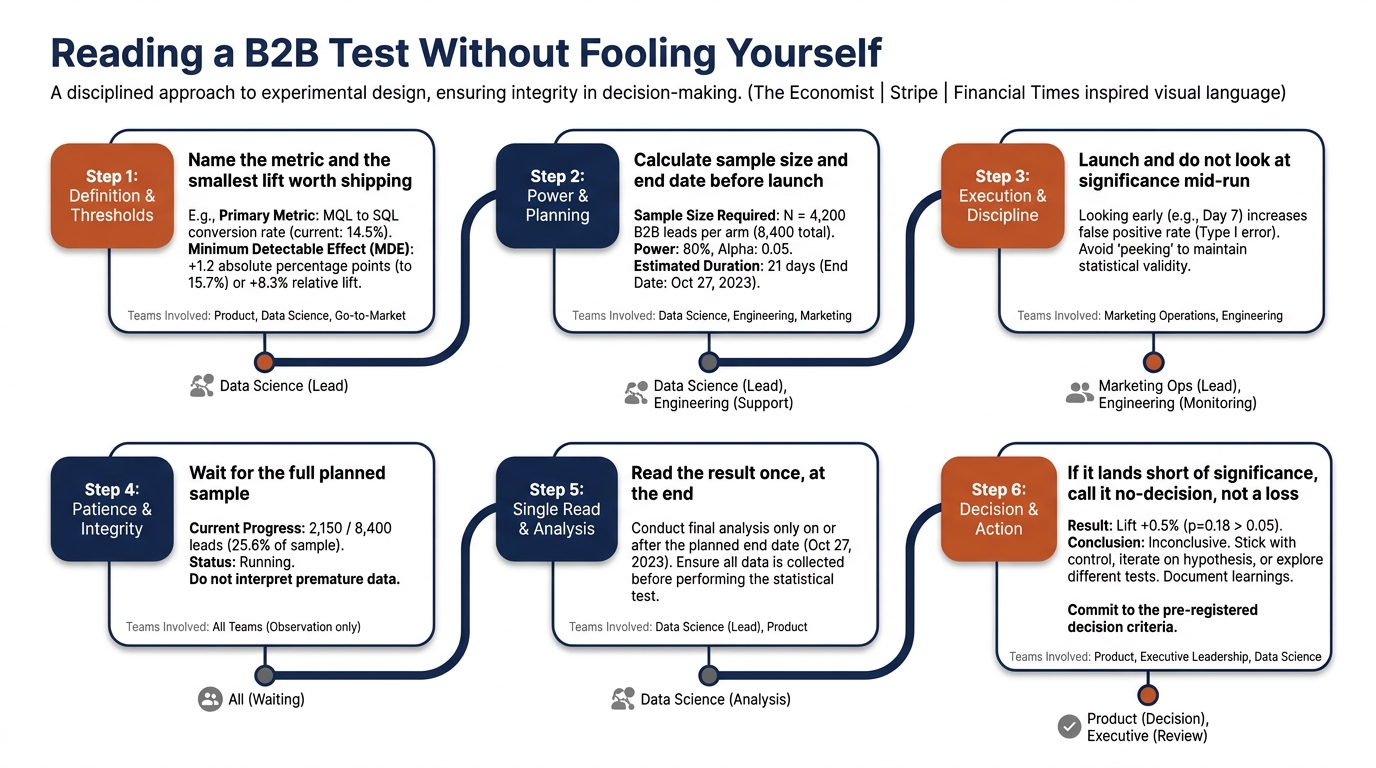
This is the behavior to break first, because it is free to fix. Decide the sample size and the end date before the test starts, and read the result once, at the end.
4. Where these errors show up on a B2B website or in a sale
The errors are not abstract. They attach to specific pages and specific buyer actions, and the risk changes with the page. Here is where to look.
Your homepage first screen is tested constantly and usually gets too little traffic to support it. In Behavly's index of 118 B2B service firms in November 2026, 49% lead with AI wording in the first screen, so a lot of teams are testing nearly identical headlines where the real difference between variants is tiny. A tiny real effect needs enormous samples to detect. That combination produces missed winners you will never notice. You can see the full pattern in the November 2026 homepage trends.
Pricing pages carry the opposite risk. Changes there move money directly, so a false positive is costly, yet only 3% of those 118 firms show a price at all, so most pricing tests run on pages buyers rarely reach in volume. If you are reworking how you present tiers, the way you frame the anchor matters more than a quick test can usually prove; the behavior behind that is covered in price anchoring on B2B pricing pages.
Demo forms and outbound email are where power is lowest, because the conversions are few and far between. A form that gets forty submissions a month will almost never produce a trustworthy test result in a reasonable window, so most "winning" form tweaks you have shipped were likely noise.
5. A worked example on one pricing page, illustrative only
The following walkthrough is illustrative, not a client result. The numbers are chosen to show the mechanism, not to report an outcome.
Suppose your pricing page converts visitors to demo requests at 4%, and you want to detect a lift to 5%. To run that test at 95% confidence and 80% power, you need roughly 7,000 to 8,000 visitors per variant before you read it. That is the price of catching a one-point lift. If your pricing page sees 2,000 visitors a month, a properly powered test runs for most of a quarter.
Now watch what the peeking trap does to it. On day four the variant shows 6.1% against 3.9%, the dashboard turns green, and stopping there feels responsible. You ship it. But you looked at a quarter of your sample during a noisy early window, and you stopped on an up-swing. Run the full sample and the two versions land within a tenth of a point of each other. You created a type 1 error by ending early, and you will spend the next quarter defending a change that did nothing.
The opposite failure is just as real. You run the full quarter, the variant finishes at 4.6% against 4.0%, and the result lands just short of significance. A real improvement was sitting in front of you, but the test lacked the power to confirm it, so you reverted. That is a type 2 error, and on a low-traffic page it is the more likely of the two.
6. The errors in a sales process, not just on the page
The same two mistakes run through how teams read their own sales signals, and they rarely get named. A deal team that wins two accounts after adding a security section to the proposal concludes the section won the deals, and bakes it into every proposal. Two wins out of a noisy pipeline is a classic false positive; the section may have done nothing, and the real driver was price or timing.
The quieter error runs the other way. A rep tries a new discovery question, it does not visibly move the next three calls, and they drop it, when the question actually helped in a way three calls could never show. This is why the one memorable deal story gets overweighted and the slow, real pattern gets ignored, a dynamic covered in the availability heuristic and the one story buyers remember. It is also why a few vivid case studies can mislead; see survivorship bias in case studies and marketing benchmarks.
7. The three-column table to keep beside your tests
Use this to decide, for each place a test touches, what the buyer is doing and what to change so you stop producing false signals.
| Where it shows up | What the buyer does | What to change |
|---|---|---|
| Homepage first screen (49% lead with AI wording) | Scans the top of the page and decides in seconds whether to stay | Test larger, clearly different variants, not near-identical headlines; a tiny real effect needs samples you do not have, so make the change big enough to detect |
| Pricing page (3% of firms show a price) | Compares tiers and judges fit and cost | Do not stop early; pricing changes move money, so run the full sample before you ship, and frame the anchor deliberately |
| Demo form / sign-up | Weighs the effort of filling it against the value of the demo | Accept that low volume means low power; run tests longer, or judge form changes by qualitative review instead of a false-confident A/B result |
| Outbound email | Opens, skims, replies or ignores | Pool enough sends before reading; a 2% reply difference on 200 emails is noise, not a winner |
| Proposal content in the sale | Reads, forwards internally, raises objections | Do not credit a new section for two wins; track it across many deals before you conclude anything |
| Any test dashboard | n/a (this is your behavior) | Set the sample size and end date up front; read the result once, at the end, never daily |
8. What to change on your page this week
You do not need a statistics overhaul to stop producing false winners. Four changes do most of the work.
- Fix the sample size and end date before any test launches. Write both down. This single habit kills most type 1 errors, because it removes the temptation to stop on a lucky day. Nielsen Norman Group's usability research is a good reminder that small-sample reads mislead.
- Stop reading significance mid-test. Hide the numbers until the planned end if your tool allows it. If it does not, agree as a team not to look.
- Make variants different enough to detect. On low traffic you cannot find a one-point lift, so test changes big enough that a real effect is large. Rewriting a weak B2B value proposition or a flat call to action gives you a bigger effect to measure than swapping two words.
- Call underpowered results a no-decision, not a loss. When a test lands short of significance, do not revert a change you had good reasons for. You failed to prove a difference; you did not prove there was none. Lowering perceived risk another way, as in risk aversion in B2B purchases, may do more than any single test.
If you want the plain-language reference for the decision science behind this, The Decision Lab and the broader Baymard Institute UX research both hold up well, and Baymard's work on form and checkout behavior pairs directly with the demo-form point above.
Before you launch your next test, see what your homepage is actually telling buyers in its first screen. Run Behavly's free homepage check on your own page and start from what visitors see, not from a dashboard that turned green too early.