
Every case study on your site describes a win. Every benchmark you quote in a sales call comes from the firms that survived long enough to be measured. That is survivorship bias at work, and it quietly inflates what a buyer thinks your service reliably delivers. When a prospect reads your three happiest clients and your one impressive conversion statistic, they are seeing the survivors and none of the accounts that churned, stalled, or never fit. Experienced buyers know this, and they discount your proof accordingly.
This guide explains the behavior, shows where it shows up on real B2B pages and in a sales process, and gives you a table and a short checklist to fix the proof you publish this week.
1. What the research says
The term came out of World War II, when the statistician Abraham Wald studied where returning bombers took damage. The obvious move was to armor the spots with the most bullet holes. Wald argued the opposite: those planes came back, so the undamaged areas were where the lost planes had been hit. The data he could see was filtered by who made it home.
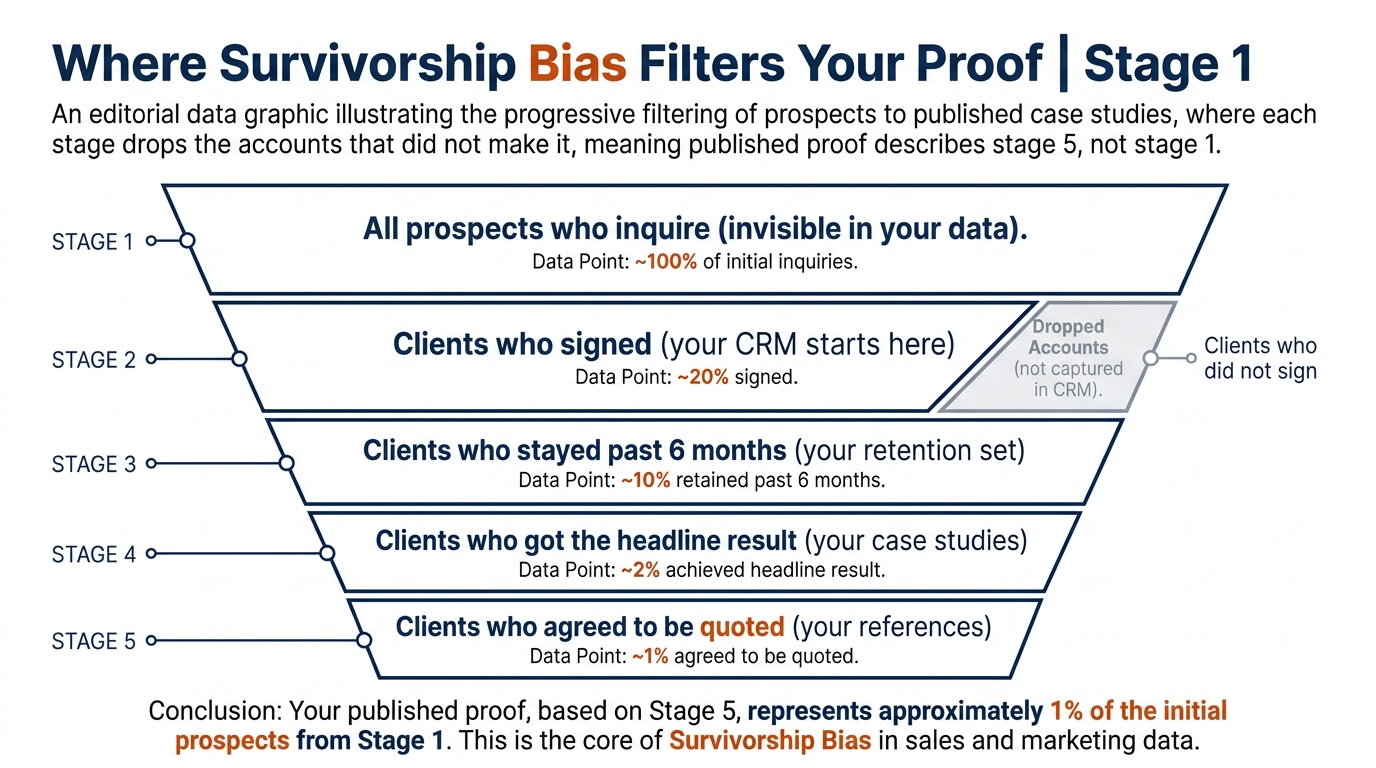
The same filter runs through most proof a B2B buyer reads. You publish the clients who stayed and got results. You rarely publish the ones who left, and the ones who never signed are invisible by definition. This is a form of selection bias, where the sample you can observe is not the sample you need to judge the outcome.
Daniel Kahneman, who won the 2002 Nobel Prize in Economic Sciences, documented how people draw confident conclusions from whatever evidence is in front of them without asking what is missing. For a buyer reading your site, the missing part is the base rate: out of everyone who bought this service, how many got the result you are showing?
2. Where it shows up on a B2B website and in a sales process
On our homepage index of 118 B2B service firms (November 2026), 80% show case studies and all of them lead with wins. None of the firms we reviewed published the share of clients who achieved the headline result. That is normal, and it is also the gap a skeptical buyer reads straight through.
Here is where survivorship bias enters the pages you own.
Case studies and logo walls
A wall of client logos shows who stayed. It says nothing about retention rate or how many similar companies tried the same engagement and left. The buyer reads the wall as proof of fit when it is proof of survival.
Benchmark data you quote
When you repeat a benchmark like "top-performing firms see X," ask who got counted. Benchmark data built only from active, reporting accounts drops the ones that failed and went quiet. The average looks better than the real population because the population shrank before anyone measured it.
The reference call
You hand a prospect three references. All three are happy, because you chose them. The prospect knows this, so a good one asks for a reference who had a rocky start, or who churned. How you answer that question moves the deal more than the three glowing calls.
3. How buyers discount survivor proof, and why that costs you
A buyer who has been burned reads your case studies as a filtered sample and marks them down. Nielsen Norman Group's usability research on trust and credibility has shown for years that specific, verifiable detail builds confidence while vague superlatives erode it. You can read the pattern across their usability research articles. Survivor proof is the vague-superlative end of that spectrum dressed up as data.
Buyers who see only survivor proof quietly discount it, and you never see the discount happen. The deal gets slower, the champion needs more internal cover, and your strongest claim carries less weight than the plain facts sitting next to it would have on their own.
This compounds with other biases on the same page. A buyer already leaning toward you will read your survivor proof as confirmation, which we covered in Confirmation Bias in B2B Buying and What It Means for Your Website. A buyer already committed to a current vendor will over-weight the cost of leaving, which is the territory of the sunk cost fallacy in B2B vendor decisions. None of these works alone, so do not expect fixing one to carry a whole decision.
4. How to publish proof that survives a skeptical read
The fix is not to stop showing wins. It is to show the denominator alongside them, so the buyer does not have to guess what you left out.
State the method
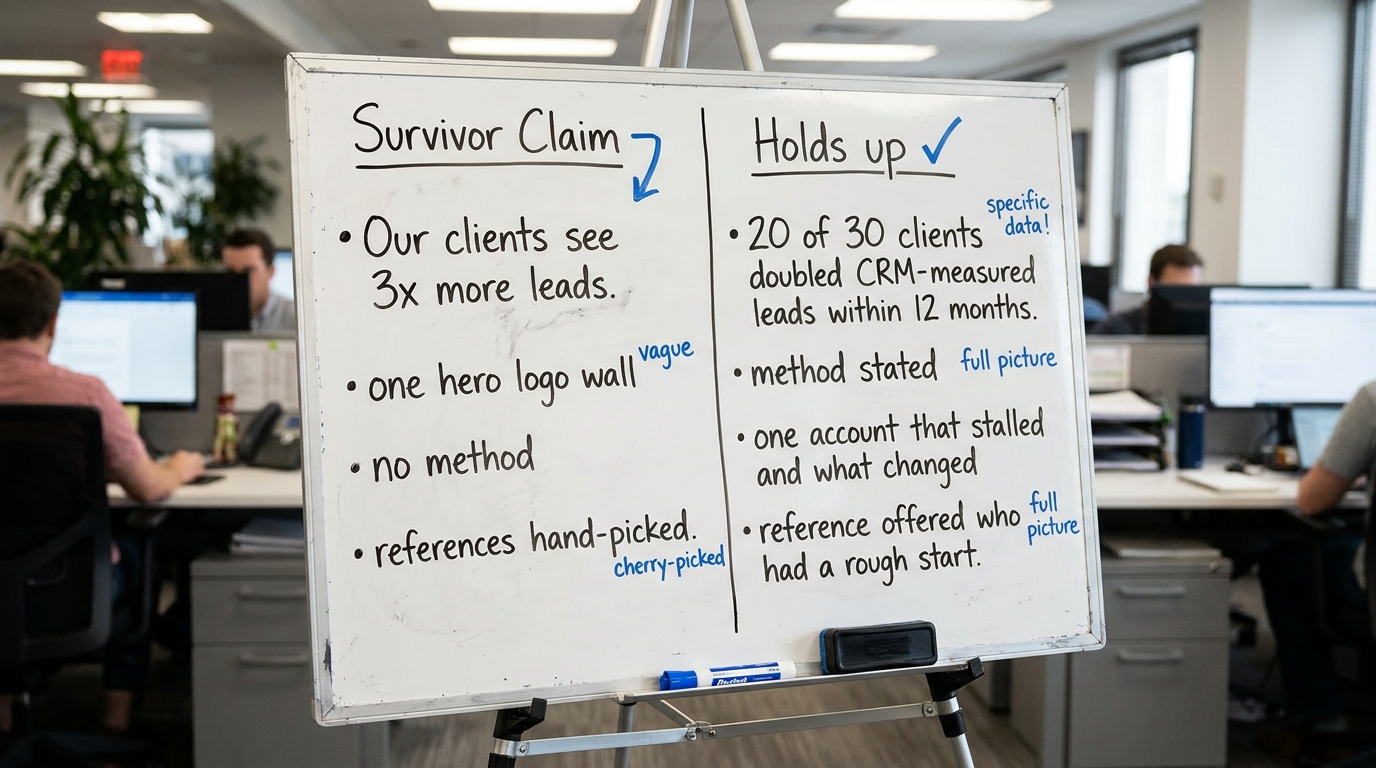
Say how the result was measured. "Organic leads, measured in the CRM, comparing the six months before and after launch" tells a buyer you are counting the same thing they would count. A number with no method is a number they will discount.
Give the base rate where you can
If 30 clients ran this engagement and 20 hit the result, say so. "Two-thirds reached the target within a year" beats one hero case study, because it admits a denominator exists and still holds up. You do not need a flattering base rate. You need an honest one, because an honest one is believable.
Name what did not work
Publish one account where the first approach failed and what you changed. A buyer who reads a candid account of a near-miss trusts the wins more, not less, because you have shown you report the cases that do not fit the headline.
Read a benchmark before you repeat it
Before you quote benchmark data, check who was in the sample and who dropped out. The Decision Lab's reference material on survivorship bias and related reasoning errors is a quick way to pressure-test a claim before it goes on your slide. If the source will not tell you the population, treat the number as a story, not a measurement.
5. The fix, by page and by sales moment
Use this table to find where survivorship bias sits in your funnel, what the buyer actually does when they hit it, and the one change that makes the proof hold.
| Where it shows up | What the buyer does | What to change |
|---|---|---|
| Case study page, headline result only | Discounts the number, assumes you hid the misses | Add the base rate ("X of Y clients") and the method used to measure |
| Logo wall on the homepage | Reads it as "who is happy," not "who fits me" | Group logos by industry or use case so fit is visible, not just survival |
| Benchmark stat in a deck or on a pricing page | Asks who was in the sample, drops the claim if you cannot say | Cite the source, the population size, and the date; drop stats you cannot source |
| Reference calls | Asks for a client who struggled or churned | Prepare one honest reference and a short account of a near-miss and the fix |
| Testimonials in the first screen | Scans past generic praise with no specifics | Replace adjectives with a measured outcome and the person's real role |
| "Trusted by 500 companies" counter | Wonders how many of the 500 renewed | Show retention or repeat-engagement rate if it is strong; cut the raw count if it is not |
6. A worked example on one pricing page (illustrative)
The following figures are illustrative. They are not a client result. If you borrow this structure, say that clearly, because a made-up number that looks real is the kind of survivor proof this guide warns against.
Suppose a managed-services firm runs a pricing page that reads: "Clients cut response time by 60%." A buyer sees one number, no denominator, no method. They file it under marketing.
Now rewrite it with the survivors and the rest both in view: "Across 40 clients on this plan in 2026, measured in the ticketing system, median response time fell 42%. Eight clients saw little change in the first quarter; six of those were missing after-hours coverage, which we now scope up front." The headline number dropped, and the claim got stronger, because the buyer can now see the population, the method, and what you do when it does not work.
On our homepage index, only 3% of the 118 firms showed a price at all, and the few that did paired it with survivor claims rather than a method. The ones that read as credible were the ones that said how they counted. You can see the wider pattern in our homepage trends for November 2026.
7. A note on decision tools trained on survivor data
A growing set of decision tools claim to forecast which accounts or strategies will succeed. Many are trained on the same survivor data this guide describes. They learn what winning accounts had in common and never see the ones that failed and disappeared. If a tool cannot tell you what sits in its training sample, treat its forecast the way you would treat an unsourced benchmark. There is a useful overview of the category in how AI foresight tools are changing business decision-making, and the same question applies: who dropped out of the data before the model saw it?
8. What to change on your page this week
You do not need to rebuild your proof. Pick the highest-traffic page with a claim on it and make three edits.
- Find every number on the page and add how it was measured, or cut it if you cannot say.
- Turn one hero case study into a base-rate line: how many clients ran this, how many hit the result.
- Add one honest account of something that did not work the first time and what you changed. Label any illustrative figure as illustrative.
- Audit one benchmark you quote in sales calls and confirm the source will tell you its sample size and date.
- Prepare one reference who had a rough start, so the question does not catch you flat.
If you want a second read on where your own homepage shows survivor proof instead of proof that holds up, run Behavly's free homepage check on your page and see what a skeptical buyer sees first.