
Most A/B tests on B2B sites fail before the first visitor arrives, because the test was built on a guess dressed up as a plan. Someone changes a button color, waits two weeks, sees no movement, and shrugs. The problem is rarely the tool. It is that there was no real hypothesis, so a flat result tells you nothing and a winning result teaches you nothing you can reuse. An A/B testing hypothesis is the thing that makes a test worth running, because it ties a specific page change to a specific buyer behavior and a number you agreed to watch before you touched anything.
This piece gives you a template for writing one, a prioritization table you can copy, and a worked example on a single homepage change. The example is illustrative, not a client result. If you own a homepage, a pricing page, or a demo form, you can apply the same structure this week.
1. Why most B2B test hypotheses are really just opinions
A test hypothesis is a claim you can be wrong about. "Let's try a shorter headline" is not a claim. "Shortening the headline to name the buyer's job will raise demo starts because visitors currently cannot tell within five seconds whether the page is for them" is a claim, and a flat result would actually argue against it.
The difference matters more on B2B pages than on consumer ones, because B2B traffic is thin. You do not get 50,000 sessions a week to brute-force your way to significance. Evan Miller's writing on how not to run an A/B test explains why peeking at results and stopping early produces false winners, and the thinner your traffic, the longer you have to wait and the more a sharp hypothesis earns its keep by pointing you at changes large enough to detect.
Our November 2026 index of 118 B2B service firms shows where the easy, testable changes sit: 49% lead with AI wording in the first screen, 33% of homepages ask the visitor for nothing at all, and only 3% show a price. Those are not opinions about your taste. They are behaviors on the page, and each one is a candidate for a hypothesis. You can see the full breakdown in our homepage trends for November 2026.
2. When to use a formal hypothesis and when not to
A written hypothesis and a controlled test are the right tools when three things hold: you have enough traffic to reach a result in a reasonable window, the change is reversible, and the outcome is genuinely uncertain. A pricing page with a few hundred weekly visitors and a real conversion event fits. A homepage headline where reasonable people disagree fits.
Skip the formal test when the fix is obvious and cheap. If 33% of homepages in our index ask for nothing, and yours is one of them, add a primary action. Nielsen Norman Group's usability research has documented the same broken patterns for years, so adding a clear next step is a correction. Test the things you cannot settle by reading the page, and fix the things you can.
When traffic is too low to ever reach significance, run the change as a before-and-after and watch a longer window, and record that you are learning from a judgment call.
The quick decision
- Test it when the change is reversible, the outcome is uncertain, and you can reach a result in weeks.
- Just fix it when the page is missing a basic element the research already settled, like a visible call to action or a price.
- Watch it when traffic is too thin for a clean test, and record it as a judgment.
3. The four parts of an A/B testing hypothesis
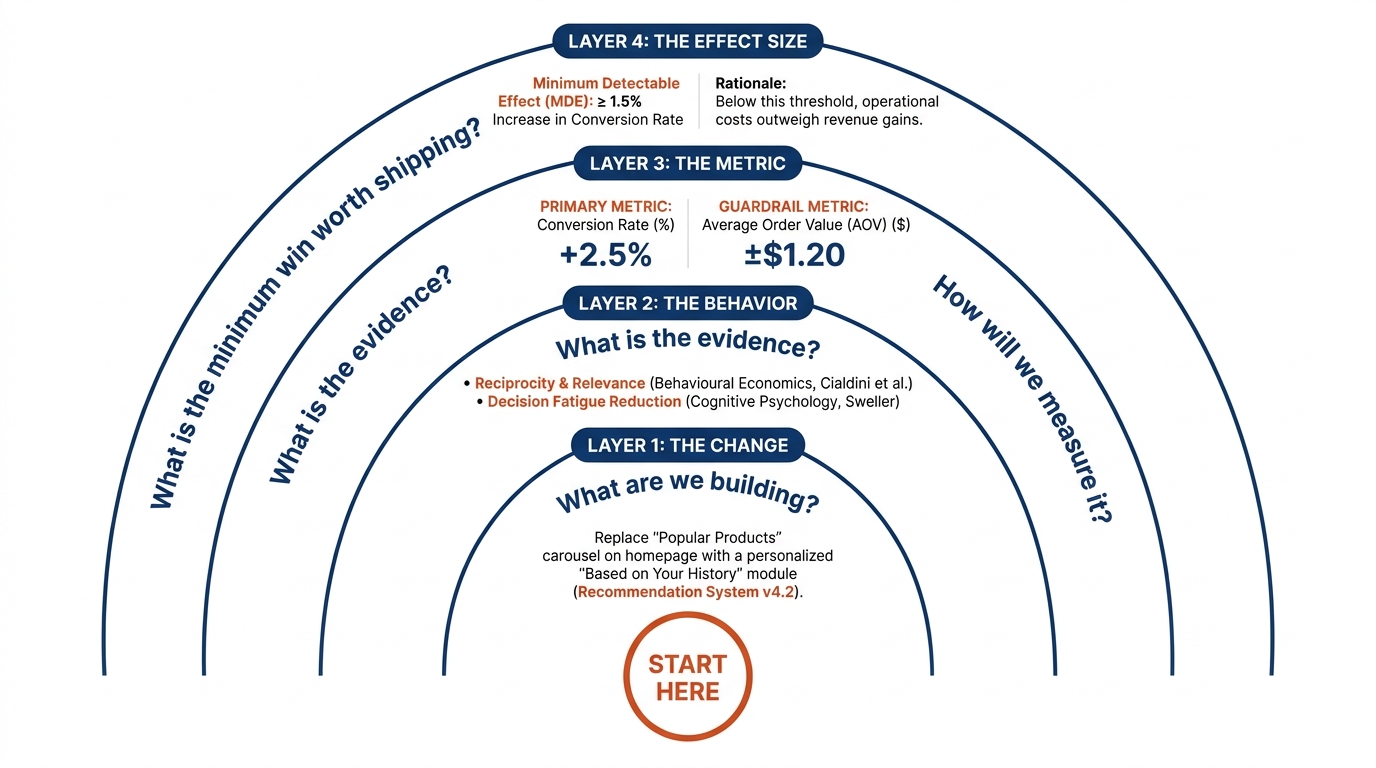
A usable hypothesis has four parts, and each one forces a decision you would otherwise skip. Write them as one sentence, then break them out so you can check each on its own.
- The change. The specific thing you will alter, described so a developer could build it without asking you a question. "Add a three-logo customer strip above the fold," not "add social proof."
- The behavior behind it. The buyer behavior you expect the change to affect, named from research. This is the part people skip, and it is the part that makes a flat result informative. If you expected the change to reduce perceived risk and nothing moved, you have learned something about risk on that page.
- The metric. You choose one primary metric before the test starts, the number you will watch to call it. One primary metric, with a guardrail metric so you do not win the click and lose the deal.
- The size of effect. The smallest improvement that would be worth the change, stated as a number. This sets how long the test must run and protects you from calling a half-percent wobble a victory.
The behavior line is where our own work on loss aversion in B2B copy and trust signals comes in. You are naming the mechanism you think is at work, and naming it from something documented rather than from a feeling. The Decision Lab's reference on behavioral science is a fair place to check whether the behavior you are invoking is real before you build a test around it.
4. The template you can copy
Here is the sentence form, then the table. Fill the table in before any test, one row per hypothesis, and keep it where the team can see it.
Because [behavior, from research], we believe [the change] will [raise or lower] [the metric] by at least [size of effect] for [which visitors].
| Field | What goes here | Example entry |
|---|---|---|
| Page | The exact URL and screen | Homepage, first screen |
| Behavior | The mechanism, named from research | Visitors cannot tell in five seconds who the page is for |
| Change | Build-ready description | Replace the AI-led headline with one naming the buyer's job |
| Primary metric | Primary metric: demo form starts | Demo form starts |
| Guardrail metric | What you refuse to damage | Demo form completions |
| Size of effect | Smallest win worth shipping | +15% relative on demo starts |
| Audience | Which visitors | New sessions from organic search |
| Run length | Decided before launch | Until the sample is reached, minimum two full weeks |
| Result | Filled in after, plain language | (blank until done) |
The guardrail row is the one teams drop and regret. On a demo form, a shorter form raises starts and can quietly cut completions, so you watch both. On a pricing page, a bolder anchor can raise clicks and lower qualified requests, which is exactly the trade our note on price anchoring on pricing pages walks through.
5. Prioritizing hypotheses with ICE and PIE
You will write more hypotheses than you can run. Test prioritization is how you choose, and two simple models do the job without a committee.
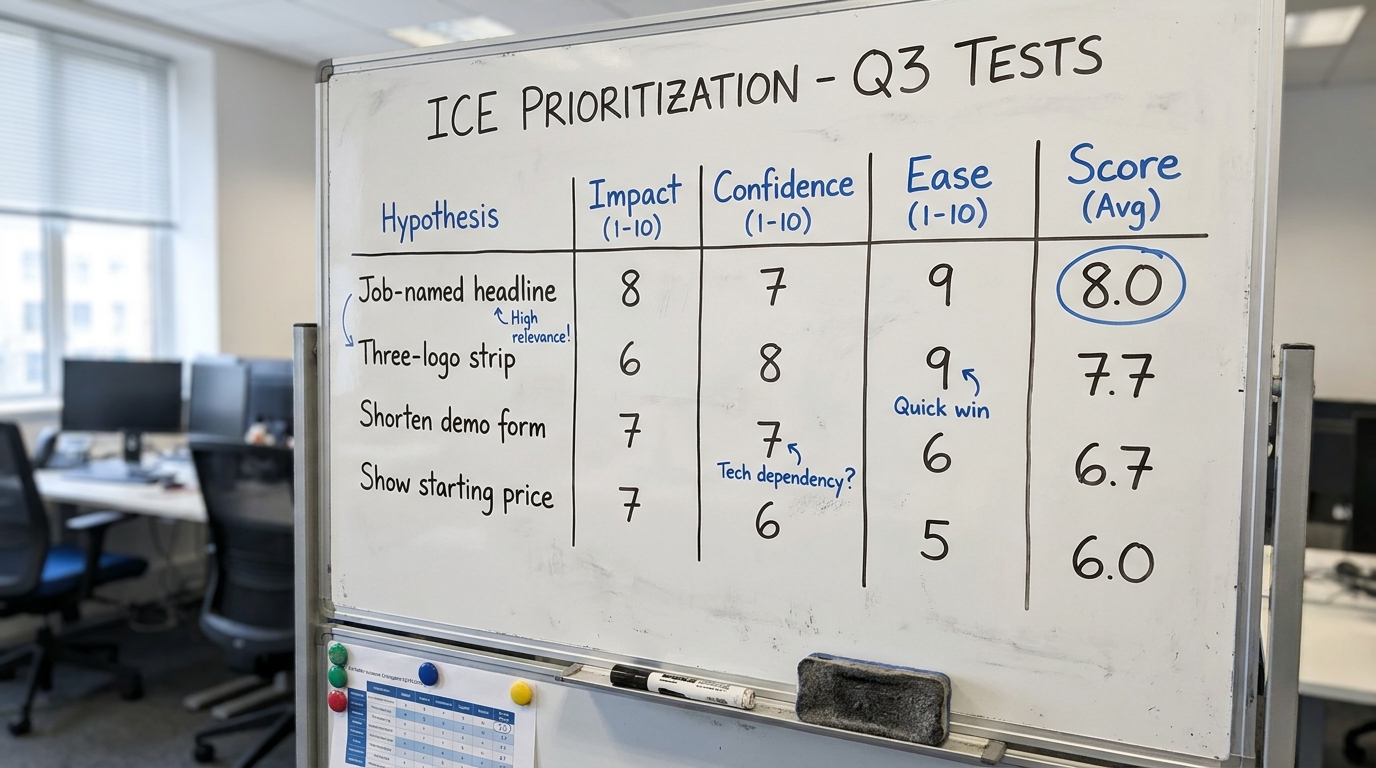
The ICE scoring model rates each hypothesis on Impact (how much the metric could move), Confidence (how sure you are, based on research and page data), and Ease (how little effort to build). Score each one to ten, average them, and rank. The PIE framework, from Chris Goward's team at WiderFunnel, scores Potential, Importance (traffic and revenue weight of the page), and Ease. Both are deliberately rough, because the point is to force a conversation and sort the list, not to produce a precise number.
For thin B2B traffic, weight importance and ease hard. A brilliant idea on a page nobody visits will never reach significance, and a hard build will sit in the backlog. Score the obvious, cheap fixes too, but remember from section two that many of them do not need a test at all.
| Hypothesis | Impact / Potential | Confidence / Importance | Ease | Score (avg) |
|---|---|---|---|---|
| Job-named homepage headline | 8 | 7 | 9 | 8.0 |
| Add three-logo customer strip above fold | 6 | 8 | 9 | 7.7 |
| Show starting price on pricing page | 7 | 6 | 5 | 6.0 |
| Shorten demo form from 9 fields to 5 | 7 | 7 | 6 | 6.7 |
Those scores are illustrative. The ranking tells you to run the headline test first, because it is high-impact, well-supported, and cheap to build, and to treat the price display as a later, harder bet. If you want help reasoning about that pricing bet, our pricing psychology for B2B services and SaaS covers the behaviors involved before you commit a test to it.
6. A worked example on one homepage change
This example is illustrative. It uses our index numbers but invents no client and no result.
Start from a real pattern: 49% of the 118 B2B service firms in our November index lead with AI wording in the first screen. Suppose your homepage is one of them, and your headline reads "AI-powered solutions for modern teams." The behavior you suspect is that a new visitor cannot tell in the first few seconds whether the page is for their kind of company, so they leave before reaching the demo form. The availability of one clear, concrete claim matters here, which is the ground our piece on the one story buyers remember covers.
Written as a hypothesis: Because new visitors cannot tell in five seconds whether the page is for them, we believe replacing the AI-led headline with one naming the buyer's job ("Compliance reporting for mid-market insurers, done in days") will raise demo form starts by at least 15% for new organic visitors, without lowering demo completions.
Every field from the template is now filled. The change is build-ready. The behavior is named and checkable. The primary metric is demo starts, the guardrail is completions, the size of effect is 15% relative, and the audience is new organic sessions. You decide run length before launch, and you hold it, because stopping the moment the line crosses is how you manufacture a false winner. Before you call anything a win, read our note on Type 1 and Type 2 errors in A/B testing so you know the difference between a real effect and noise that happened to point up.
Reading the result without fooling yourself
If demo starts rise past your threshold and completions hold, you ship it, and you have also learned that clarity of fit drove the behavior on that page. If the result is flat, that is still information: the headline was not the constraint, so you move down the ranked list to the trust strip or the form. A flat result only feels like a waste when the hypothesis had no behavior line to argue with in the first place. The textbook on this, Kohavi, Tang and Xu's Trustworthy Online Controlled Experiments, makes the same point at length: the discipline is in how you set up and read the test.
7. What to change on your page this week
You do not need a testing tool to start. You need one honest hypothesis written down.
- Open the template table and fill one row for your highest-traffic page, forcing yourself to name the behavior you expect to change.
- Score three or four candidate hypotheses with ICE or the PIE framework, and be ruthless about ease and importance given your traffic.
- Separate the real tests from the obvious fixes. If your homepage asks for nothing, like a third of the firms in our index, add a clear next step now and save your testing budget for the uncertain calls. Our guide to call to action copy for B2B websites helps with that one.
- Set the run length and the guardrail metric before you launch, and write them next to the hypothesis so you cannot quietly move them later.
If you want a second read on which first-screen behavior is costing you the most before you write the hypothesis, run Behavly's free homepage check on your own page.